Insights
Ilmiya’s Student Reports give educators, parents, and administrators a clear, detailed picture of how each student is doing — where they’re excelling, where they’re struggling, and exactly where to focus attention next.
Overview Dashboard
Section titled “Overview Dashboard”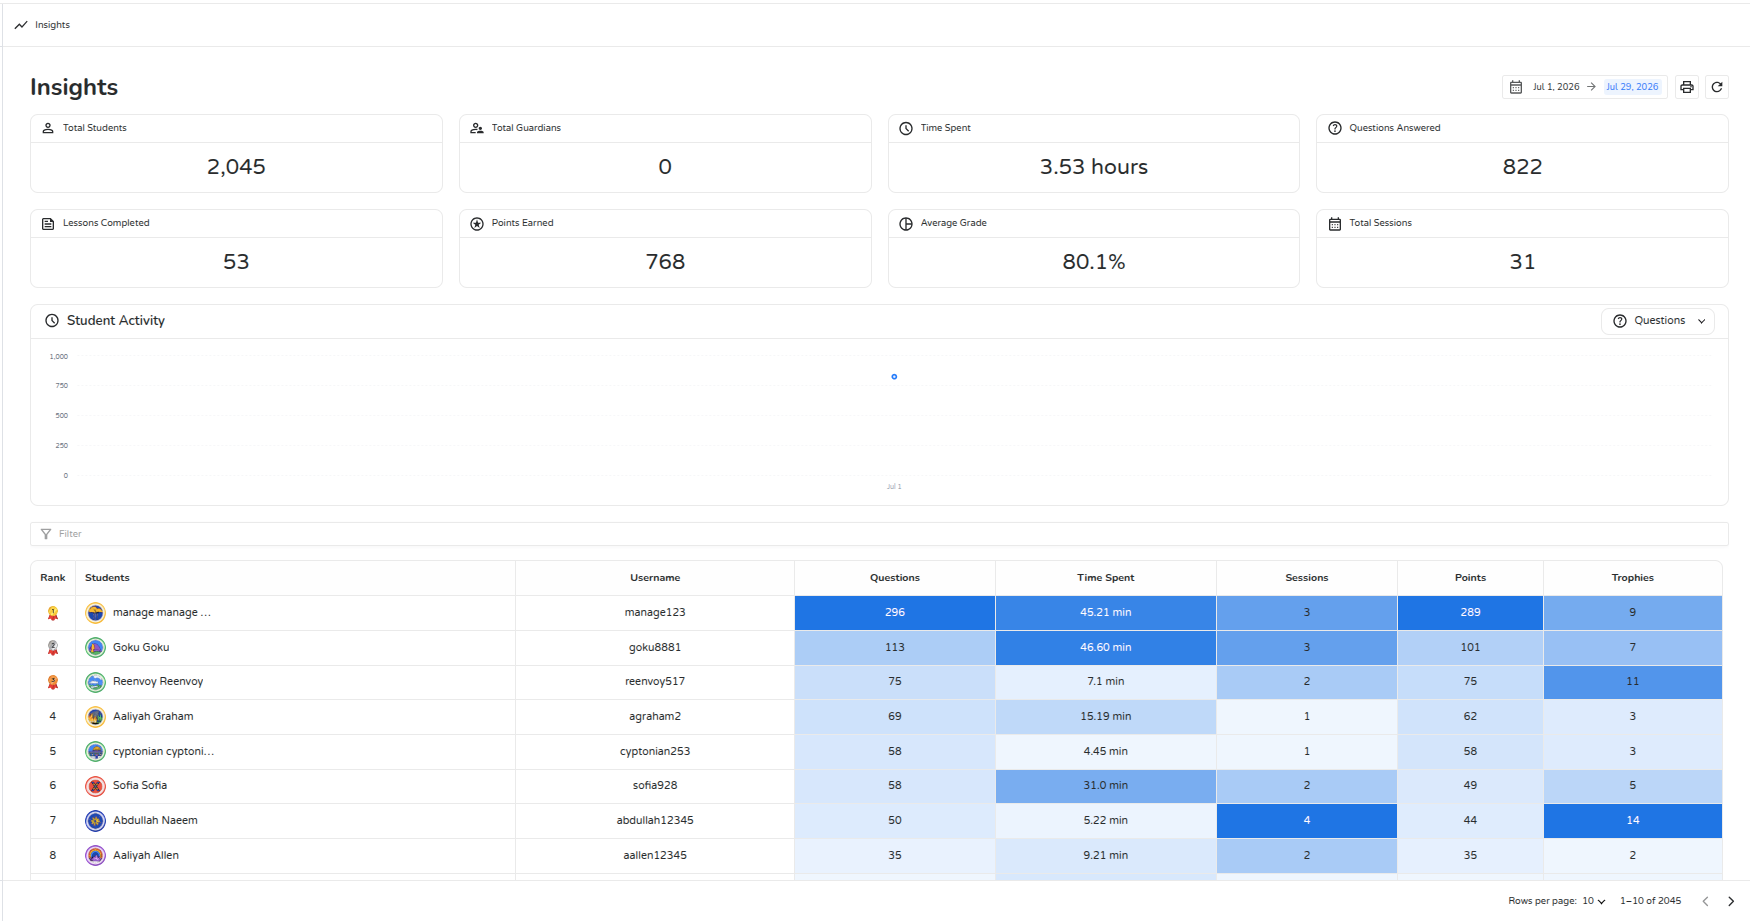
The first thing you see is a set of 8 summary cards across the top, giving you a snapshot of your whole class or organization at a glance:
- Total Students
- Total Guardians
- Time Spent
- Questions Answered
- Lessons Completed
- Points Earned
- Average Grade
- Total Sessions
Below the cards, a Student Activity chart plots a running total over time. A dropdown switches what it’s tracking — Questions, Time Spent, or Points — instantly, since it just redraws using data that’s already loaded.
Student List
Section titled “Student List”Underneath the chart is a sortable, page-by-page table showing, for every student: rank, name, and username, plus questions attempted, time spent, sessions, points, and trophies earned.
- The top 3 ranked students get a gold/silver/bronze badge instead of a plain number, so standouts are visible immediately.
- Every numeric column (Questions, Time, Sessions, Points, Trophies) is color-shaded — the higher a student’s number relative to their classmates on that page, the darker the blue — so you can scan the whole table and spot who’s ahead or falling behind without reading every cell.
- Click any column heading to sort by that metric — e.g. sort by “Time Spent” to see who’s practicing most, or by “Points” to find your top earners.
- A search box jumps straight to a specific student by name.
Controls
Section titled “Controls”- A date range picker (defaults to the current month) — every card, the chart, and the table update together when you change it.
- A Refresh button forces the numbers to recalculate from scratch — useful right after a burst of activity if you want the freshest possible numbers.
- A print/export button saves the whole dashboard as an image — handy for reports or sharing with a parent or administrator who doesn’t have login access.
Individual Performance
Section titled “Individual Performance”Click into a specific student to see their full picture:
- Total questions attempted — their overall volume of practice
- Lessons completed — how far they’ve progressed
- Average grade — their overall performance
- Subjects studied — which areas they’ve covered
- Lesson-by-lesson breakdown — flags exactly which lessons need more attention, rather than leaving you to guess from an overall average
Lesson & Question Breakdown
Section titled “Lesson & Question Breakdown”Drill into any single lesson to see questions attempted, correctness rate, and time spent for that lesson specifically, along with the mastery level the student reached:
| Tier | Accuracy |
|---|---|
| Expert | 100% |
| Proficient | 85–99% |
| Competent | 70–84% |
| Beginner | below 70% |
Every individual answer is available too, so you can spot patterns — e.g. a student consistently missing a particular type of question — and give feedback that’s actually targeted at the real problem, not a general nudge.
Question Preview
Section titled “Question Preview”From the lesson breakdown, click any question to preview exactly what the student saw and how they answered — multiple choice, drag-and-drop, fill-in-the-blank, video, audio, and more — rendered using the same component the student interacted with live, just filled in with their actual answer and locked to read-only.
Sessions & Time Spent
Section titled “Sessions & Time Spent”A session is simply a day the student spent any time in the app — it doesn’t matter if that was 5 minutes or 5 hours, it counts as one session for that day.
| Value | Formula |
|---|---|
| Total Sessions | Distinct days with any recorded time, within the selected date range |
| Average Session | Total time spent ÷ Total Sessions, rounded down (kept simple and conservative rather than optimistic) |
totalSessions = number of distinct days with any recorded timeavgSession = total time spent ÷ number of those days (rounded down; 0 if either is 0)Both appear on the Activity tab (and as summary cards on the Overview dashboard).
Two students can have the same “Total Time Spent” but very different session patterns — one shows up daily for a short burst, another logs in twice a week for a long session. Sessions tell you how consistently a student engages, which Total Time alone can’t show you.
Total Time Spent
Section titled “Total Time Spent”This number reflects genuinely engaged time, not just “app was open” time — the clock pauses during loading screens, pop-ups, or idle moments, so a student who left a lesson open overnight won’t show fake hours of progress.
It’s built up in layers, though as a reader you never need to think about the layers directly — just know that the total is trustworthy end to end:
- Per question — Each answered question gets its own small slice of time, floored at a minimum of 0.5 seconds so nothing is ever recorded as exactly zero, even for a very fast answer.
- Per attempt — Those slices sum into a total for that attempt (one full run through a lesson).
- Per lesson — If a student resumes an unfinished lesson later, the timer continues from where they left off rather than restarting at zero — so a lesson’s total genuinely reflects everything they’ve ever spent on it, across every visit.
- Per student — All of a student’s lesson totals together produce their overall total, shown as:
- A table — one row per lesson with that lesson’s total time; the grand total is the sum of all rows
- A daily chart — a time-over-date series, filterable by date range, so you can see not just how much time was spent, but when
student's total time spent = Σ lessons ( = Σ attempts ( = Σ questions ) )Where to Find What
Section titled “Where to Find What”Insights pulls together data that actually lives across three different parts of the platform — knowing which one you’re in helps you find what you need faster:
| I want to see… | Go to… |
|---|---|
| A quick snapshot of the whole class/org | Analytics → Insights (Overview) |
| Session counts and activity trends over time | Analytics → Activity |
| Lesson history, mastery tiers, and time totals per student | Analytics → Grades |
| Question-by-question detail for one attempt | Studio → Results, or Analytics → Insights |
| A student’s own view of their own progress | Campus → Grades — this is what the student themselves sees when they check their own progress |
Why This Matters
Section titled “Why This Matters”| Benefit | Impact |
|---|---|
| Personalized Attention | Tailor support to each student’s specific needs |
| Data-Driven Decisions | Plan lessons and assignments based on real performance, not guesswork |
| Parental Involvement | Keep parents genuinely informed, not just reassured |
| Self-Improvement | Students can track their own learning and act on it themselves |
| Efficient Classroom Management | Focus your limited time where it actually makes a difference |
Ilmiya’s Student Reports turn raw activity into clear, actionable insight — helping educators teach better and students reach their full potential.